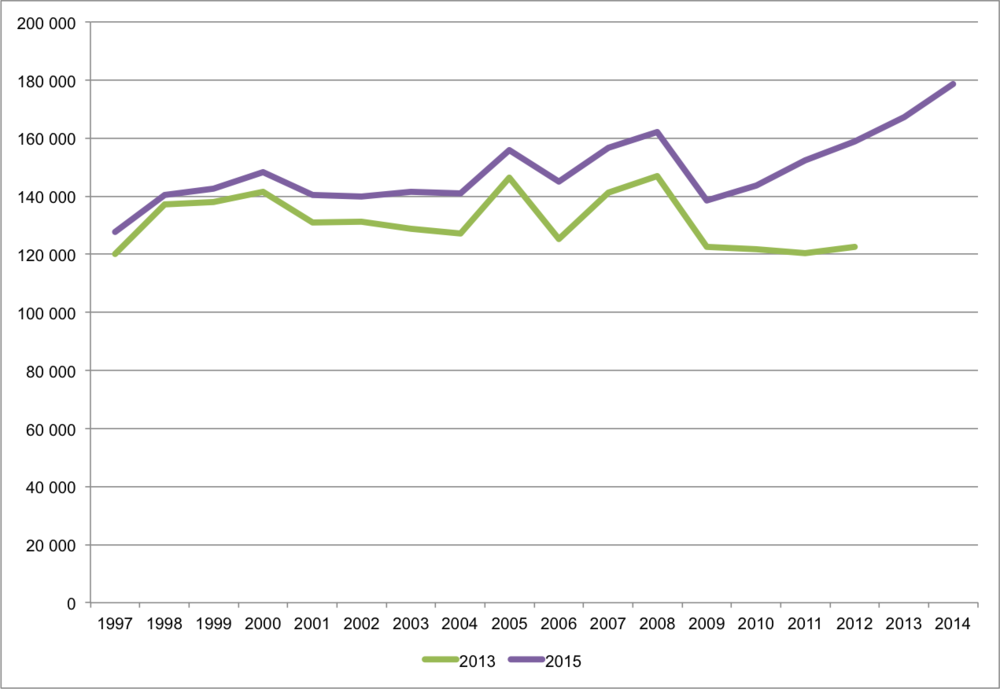
- Business investment (NPEL)
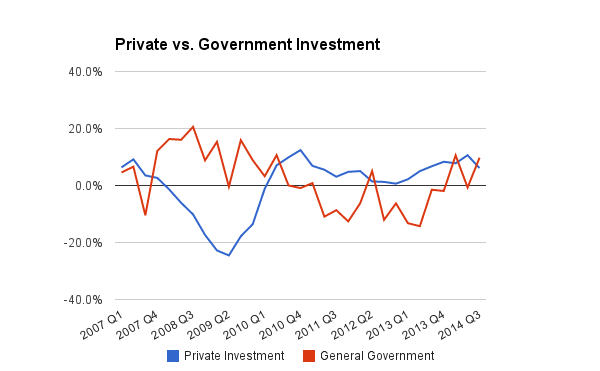
- Private sector dwellings (L636)
- Private sector costs (L637)
And we contrast this with:
- General government (DLWF)
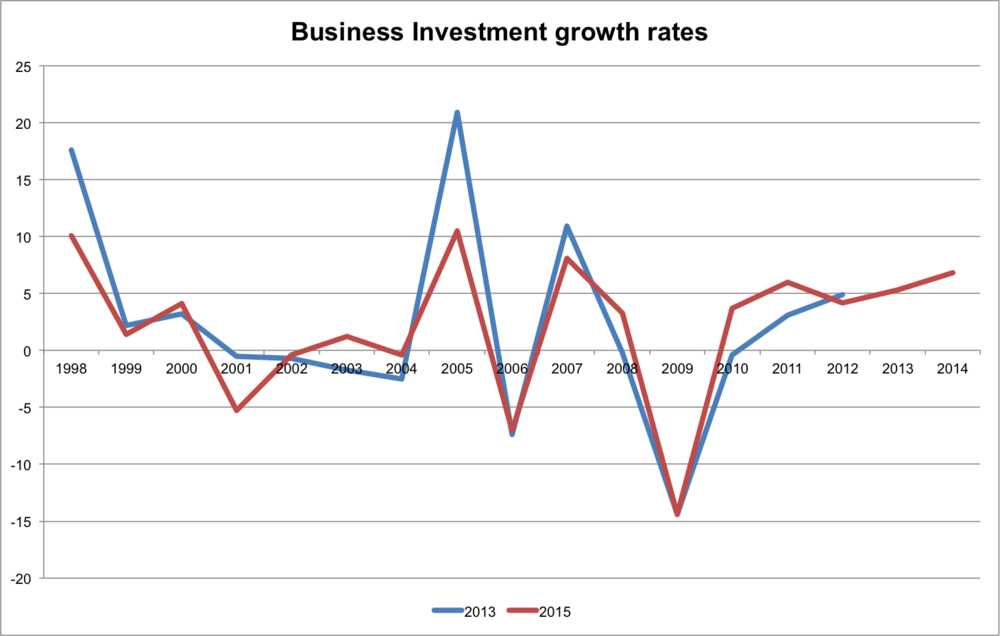
The chart below shows the updated figures compared to using the 2013 methods:

As previously mentioned, the main difference is the stronger recovery in 2010. Note that we are using quarter on quarter (of same quarter of previous year) data. There is dramatic volatility with the private investment figure, showing -24.5% in Q2 2009 and +12.4 in Q4 2010. This may be the result of the way in which we are measuring growth. I tend to prefer QoQofY rather than QoQ because the latter tends to be more volatile, and the former shows the bigger picture. For example, here is a comparison of the two different growth rates for total Gross Fixed Capital Formation (i.e. investment):
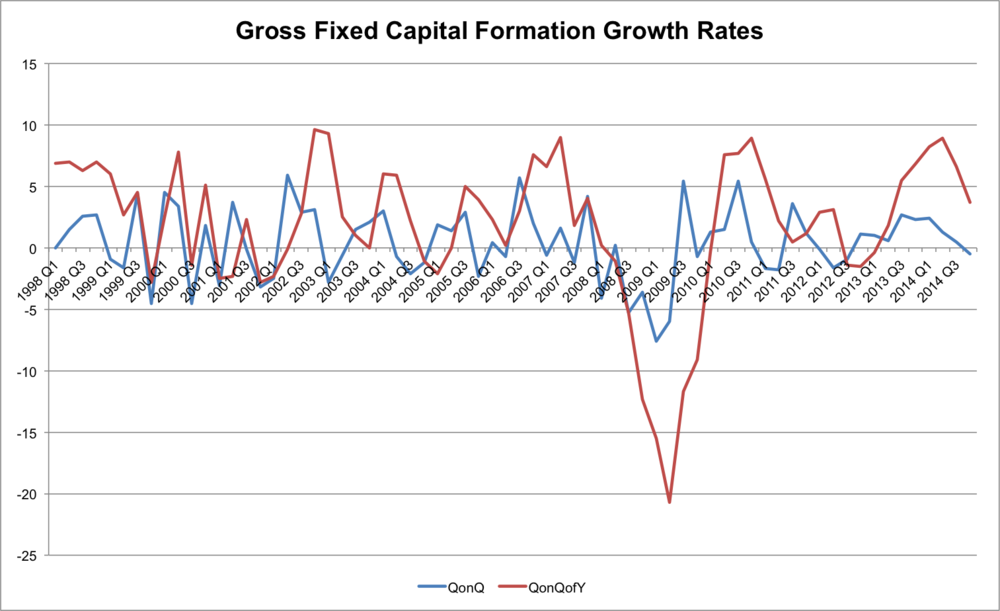
These are the two measures published by the ONS. An alternative, however, is to annualise the data. Here is the chart showing Private vs. Government Investment with the quartely growth rate compared to an annualised one:
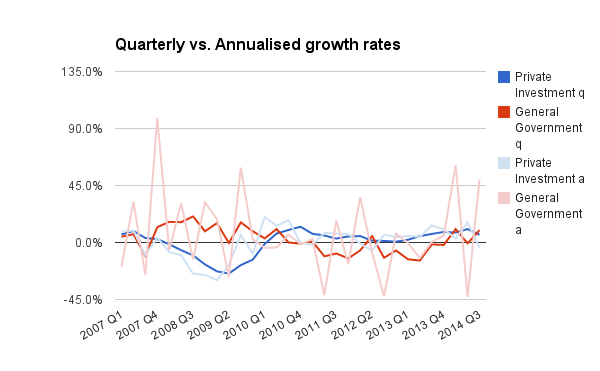
As you can see, the darker lines (quarterly growth) are less volatile than the lighter lines (annualised). This is the reason we opt for quarter on quarter (of same quarter of previous year) growth rates.